
 English
 Polski
 Română
 Slovenščina
Κεφάλαιο 6: Αγοραστική συμπεριφορά και κοινωνικές αγορές
Εισαγωγή
“Επειδή ο σκοπός μιας εταιρείας είναι να δημιουργήσει έναν πελάτη, η επιχείρηση έχει δύο -και μόνο δύο- βασικές λειτουργίες: το μάρκετινγκ και την καινοτομία. Το μάρκετινγκ και η καινοτομία παράγουν αποτελέσματα- όλα τα υπόλοιπα είναι κόστος. Το μάρκετινγκ είναι η διακριτική, μοναδική λειτουργία της επιχείρησης”[1].
Γιατί μάρκετινγκ; Επειδή είναι σημαντικό για τις εταιρείες να κατανοήσουν πλήρως τη συμπεριφορά των καταναλωτών, είτε πρόκειται για ιδιώτες είτε για θεσμικούς αγοραστές.
Όταν γίνεται λόγος για τη συμπεριφορά των αγοραστών, είναι καλό να καταλάβει κανείς πώς αποφασίζουν; Γιατί προτιμούν ένα μέρος από ένα άλλο; Πώς η αυξημένη πρόσβαση στην πληροφόρηση επηρεάζει τις επιλογές αγοράς και δαπανών; Η απάντηση της Delloitte αναφέρεται, για παράδειγμα, στα τρία R – έρευνα, συστάσεις και επιστροφές – τα οποία μπορεί να κρύβουν το κλειδί για την κατανόηση των καταναλωτών.
Έρευνα
Αν μιλάμε για έρευνα – βασίζεται στην ψηφιακή τεχνολογία που παρέχει ένα άνευ προηγουμένου επίπεδο πληροφοριών. Εδώ μπορούμε να μιλήσουμε για influencers που μπορεί να είναι εντελώς άγνωστοι άνθρωποι αλλά που μπορούν να επηρεάσουν την απόφαση αγοράς.
Συστάσεις και κριτικές
Οι συστάσεις και οι κριτικές για προϊόντα, αγαθά και υπηρεσίες γίνονται όλο και πιο περιζήτητες για τον σχεδιασμό αποφάσεων αγοράς.
Οι καταναλωτές επιδιώκουν να συλλέγουν πληροφορίες από
- Κριτικές εμπειρογνωμόνων
- Γνώμες χρηστών
Σύμφωνα με την EUROPE E-COMMERCE REPORT 2021, οι αξιολογήσεις πελατών αποτελούν “σημαντική πηγή ανατροφοδότησης, μηχανισμό ενίσχυσης της εμπιστοσύνης και πηγή πληροφοριών για τους (δυνητικούς) πελάτες.
Εντός της ΕΕ,
- Το 59% των ηλεκτρονικών καταστημάτων προσφέρει στους πελάτες τη δυνατότητα να γράψουν
- κριτικές προϊόντων, και
- Το 23% παρέχει στους καταναλωτές τη δυνατότητα να αξιολογήσουν την ίδια την εταιρεία.
Επιστροφές
Η δυνατότητα επιστροφής είναι ένα στοιχείο που ενθαρρύνει τον καταναλωτή να αγοράσει, επειδή γνωρίζει ότι μέσα σε ένα ορισμένο χρονικό διάστημα μπορεί να επιστρέψει το προϊόν χωρίς ποινή ή με ένα μικρό πρόστιμο. Σε αυτή την περίπτωση, οι τύψεις, η δυσαρέσκεια, η κακή αξιολόγηση του προϊόντος πριν από την αγορά αποτελούν λόγους επιστροφής.
Στόχος αυτού του κεφαλαίου είναι να κατανοήσουμε τη συμπεριφορά των καταναλωτών ως ένα σημαντικό ζήτημα για το αποτελεσματικό μάρκετινγκ, βοηθώντας τα στελέχη να λάβουν αποφάσεις για τις διαδικασίες πώλησης.
Μαθησιακοί στόχοι:
- Τοποθέτηση της κατανάλωσης στο πλαίσιο της ανθρώπινης συμπεριφοράς
- Προσδιορισμός της συμπεριφοράς των καταναλωτών στο πλαίσιο της εξέλιξης των ηλεκτρονικών αγορών και των κοινωνικών αγορών.
Ο αγοραστής, ο πελάτης ή ο καταναλωτής είναι τρεις σχεδόν παρόμοιες εκφράσεις και αντιμετωπίζονται ως τέτοιες:
Αγοραστής[2] – το πρόσωπο που είναι υπεύθυνο για την επιλογή, την αγορά, την τιμολόγηση και την έκθεση των εμπορευμάτων ενός καταστήματος λιανικής πώλησης
Πελάτης[3] – πρόσωπο που αγοράζει ένα προϊόν ή χρησιμοποιεί μια υπηρεσία από μια επιχείρηση
Καταναλωτής[4] – πρόσωπο που αγοράζει αγαθά και υπηρεσίες
Τι κοινό έχουν αυτοί οι άνθρωποι;
Αναζητούν:
– Πηγές πληροφοριών για τα προϊόντα;
– Τρόπους αξιολόγησης εναλλακτικών προϊόντων (γνώμες, κριτικές, μέσα κοινωνικής δικτύωσης, παράγοντες επιρροής)
– Πληροφορίες για άλλους χρήστες (εμπειρίες)
Είναι πληροφορημένοι/έχουν αναλύσει:
– Ποια είναι η σχέση ποιότητας-τιμής του προϊόντος
– Ποιοι είναι οι κίνδυνοι από την αγορά του προϊόντος/υπηρεσίας
– Τι επηρεάζει την απόφαση αγοράς;
Από την άλλη πλευρά, η μέθοδος B2C στοχεύει να ανακαλύψει:
– Ποιος/τι επηρεάζει την απόφαση αγοράς ή χρήσης ενός προϊόντος
– Πώς διαμορφώνεται και αλλάζει η αφοσίωση σε κάποιο εμπορικό σήμα;
– Ποιοι είναι οι εσωτερικοί παράγοντες που επηρεάζουν την απόφαση αγοράς (ψυχολογικοί, προσωπικοί, κοινωνικοί)
Συνοψίζοντας, ένας τυπικός ορισμός της καταναλωτικής συμπεριφοράς θα μπορούσε να είναι ο εξής:
- Οι διανοητικές, συναισθηματικές και σωματικές δραστηριότητες στις οποίες εμπλέκονται οι άνθρωποι όταν επιλέγουν, αγοράζουν, χρησιμοποιούν και εγκαταλείπουν προϊόντα και υπηρεσίες για να ικανοποιήσουν ανάγκες και επιθυμίες[5].
Σύμφωνα με τη Eurostat, το 74 % των χρηστών του διαδικτύου στην ΕΕ έκανε ηλεκτρονικές αγορές το 2021 και το 42 % των ηλεκτρονικών αγοραστών πραγματοποίησε αγορές για ποσό από 100 έως λιγότερο από 500 ευρώ τους τελευταίους 3 μήνες πριν από την έρευνα της Eurostat[6].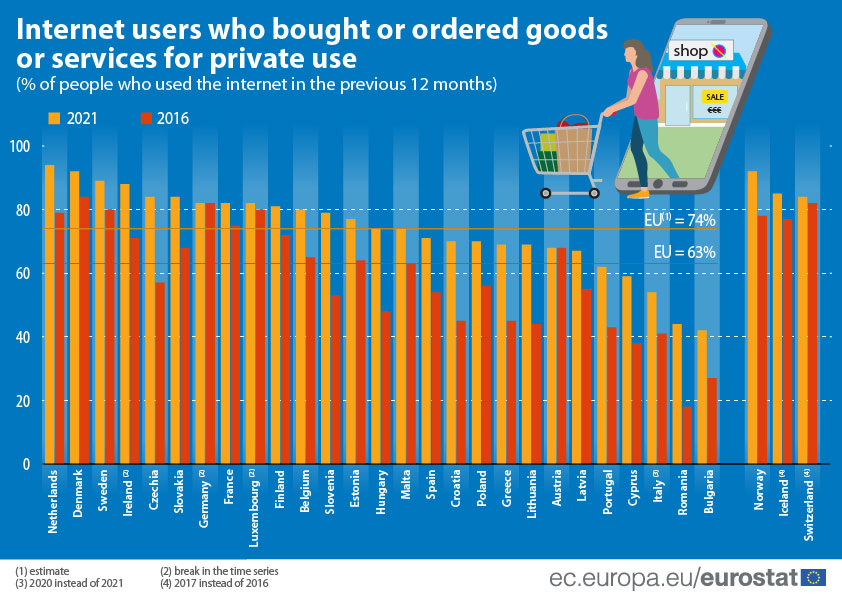
Τύποι καταναλωτικής συμπεριφοράς
Όλοι μας είμαστε καταναλωτές, επομένως η καταναλωτική συμπεριφορά αποτελεί αναπόσπαστο μέρος της καθημερινής μας ζωής. Όμως δεν είμαστε όλοι ίδιοι και οι ψυχολογικές και κοινωνικές διαδικασίες που εμπλέκονται στην αγορά και την κατανάλωση αγαθών και υπηρεσιών κάνουν τη διαφορά.
Η βιβλιογραφία αναγνωρίζει τέσσερις τύπους καταναλωτικής συμπεριφοράς:
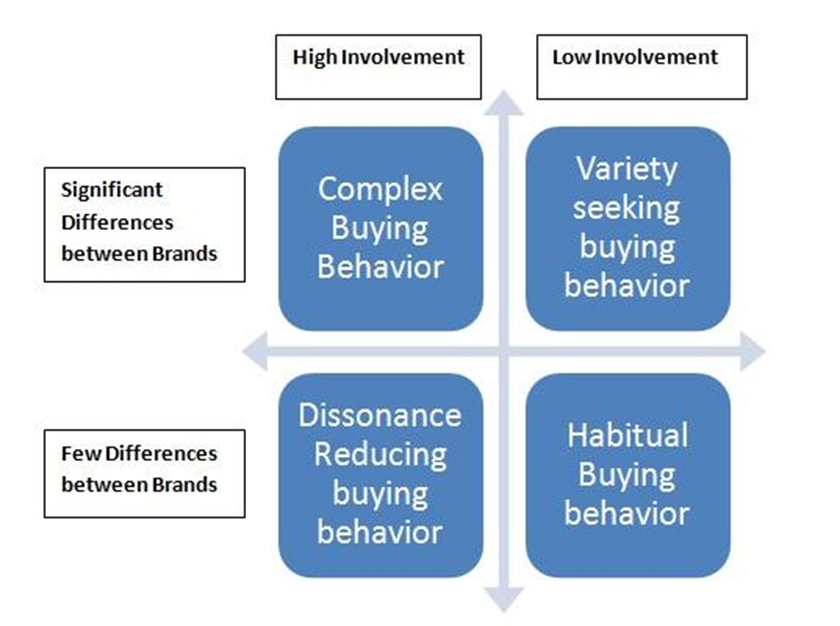
Σχήμα 1 Πηγή: https://clootrack.com/knowledge_base/types-of-consumer-behavior/
- Πολύπλοκη αγοραστική συμπεριφορά – Αγοράζοντας κάτι πολύ ακριβό, όπως ένα σπίτι ή ένα φανταχτερό αυτοκίνητο. Οι άνθρωποι σε αυτό το πλαίσιο:
- κάνουν έρευνα σε βάθος πριν από την απόφαση αγοράς,
- αναζητούν συμβουλές (οικογένεια, φίλοι, ειδικοί),
- ενημερώνονται από πολλαπλές πηγές,
- αναζητούν στο διαδίκτυο την προσφορά της αγοράς και εξετάζουν εναλλακτικές λύσεις, πλεονεκτήματα και μειονεκτήματα.
- Αγοραστική συμπεριφορά που μειώνει τη δυσαναλογία – αγοράζοντας σπάνια ένα αγαθό ή μια υπηρεσία. Εξαιτίας της χαμηλής διαθεσιμότητας επιλογών με λιγότερο σημαντικές διαφορές μεταξύ των εμπορικών σημάτων και των τιμών, οι καταναλωτές δεν έχουν πολλές επιλογές και δεν είναι απαραίτητη η έρευνα για την απόφαση αγοράς.
Μερικά χαρακτηριστικά:
- Σπάνιες αγορές
- Χαμηλή διαθεσιμότητα επιλογών
- Περιορισμένη λήψη αποφάσεων
- Χρονικοί περιορισμοί
- Περιορισμοί στον προϋπολογισμό.
- Αγοραστική συμπεριφορά συνήθειας – περιλαμβάνει τις καθημερινές αγορές που κάνει ένας πελάτης. Δε χρειάζεται πολλή σκέψη, είναι περισσότερο θέμα συμπεριφοράς. Για παράδειγμα, όταν ένας καταναλωτής αγοράζει εμφιαλωμένο νερό, τείνει πάντα να αγοράζει τη γνωστή μάρκα χωρίς μεγάλη έρευνα και επένδυση χρόνου. Γνωρίζει το προϊόν και του αρέσει.
- Αγοραστική συμπεριφορά αναζήτησης ποικιλίας – Ο αγοραστής αυτής της κατηγορίας απολαμβάνει την αλλαγή της δικής του αγοραστικής απόφασης, καθώς υπάρχουν πολλές μάρκες στην αγορά και υπάρχει χαμηλό κόστος για τη λήψη της απόφασης. Για παράδειγμα, ο καταναλωτής αγοράζει μια μέρα ένα συγκεκριμένο εμφιαλωμένο νερό και την επόμενη μέρα το αλλάζει για να δοκιμάσει κάτι νέο. Περισσότερα για τους τύπους συμπεριφοράς των καταναλωτών μπορείτε να δείτε στο YouTube: Steven Fob[1] – Four Types of Buying Behaviour https://www.youtube.com/watch?v=Bnrdv-7ndFo
Τι είναι οι κοινωνικές αγορές;
Λοιπόν, οι κοινωνικές αγορές μπορούν να θεωρηθούν ως μια περιπέτεια αγοράς πραγμάτων που συνδυάζει το ηλεκτρονικό εμπόριο με τα μέσα κοινωνικής δικτύωσης, επιτρέποντας στους ανθρώπους να αγοράζουν απευθείας σε διάφορες πλατφόρμες όπως το Facebook, το Instagram και το Tik Tok.
Η σημασία των κοινωνικών αγορών είναι αμφίδρομη. Από τη μία πλευρά υπάρχει μια τεράστια βάση καταναλωτών που μπορεί να αγοράσει εύκολα μέσω των πλατφορμών κοινωνικής δικτύωσης και από την άλλη οι εταιρείες μπορούν να τοποθετήσουν το κατάστημά τους απευθείας στις πλατφόρμες.
Σύμφωνα με την ευρωπαϊκή έκθεση 2021 για το ηλεκτρονικό εμπόριο[2]:
- Το 93% των ευρωπαϊκών διαδικτυακών καταστημάτων εμφανίζουν τα μέσα κοινωνικής δικτύωσης στον ιστότοπό τους
- Τα πιο δημοφιλή κανάλια πολυμέσων που χρησιμοποιούν τα ηλεκτρονικά καταστήματα είναι το Facebook, το Instagram και το YouTube.
- Οι λιγότερο συχνά χρησιμοποιούμενες πλατφόρμες κοινωνικής δικτύωσης είναι το Tumblr, το Snapchat και το TikTok.
- Τα διαδικτυακά καταστήματα από τη Βόρεια Ευρώπη έχουν λιγότερους λογαριασμούς Pinterest (8%), YouTube (55%) και Instagram (69%) στην ιστοσελίδα τους.
- Επιπλέον, το Twitter είναι πολύ πιο δημοφιλές μεταξύ των ηλεκτρονικών καταστημάτων στη Δυτική Ευρώπη (71%) και τη Νότια Ευρώπη (53%), σε σύγκριση με τη Βόρεια Ευρώπη (24%) και την Ανατολική Ευρώπη (26%).
Σύμφωνα με την ίδια έκθεση, οι πιο δημοφιλείς τρόποι χρήσης των επιλογών επικοινωνίας στην ΕΕ των 27 είναι οι εξής:
- Τηλεφωνική επικοινωνία – 90%
- E-mail – 74%
- Φόρμα επικοινωνίας – 66%
- Διαδικτυακή συζήτηση (chat) – 47%
- Άμεση ανταλλαγή μηνυμάτων/VOIP – 11%
- Φαξ – 8%
Η γνώση των προτιμώμενων επιλογών επικοινωνίας των καταναλωτών βοηθά τα διαδικτυακά καταστήματα να σχεδιάσουν τα κατάλληλα κανάλια επικοινωνίας προς τους πλούσιους καταναλωτές.
[1] Steven Hob Four Types of Buying Behaviour https://www.youtube.com/watch?v=Bnrdv-7ndFo visited 13.02.2022
[2] https://ecommerce-europe.eu/wp-content/uploads/2021/09/2021-European-E-commerce-Report-LIGHT-VERSION.pdf
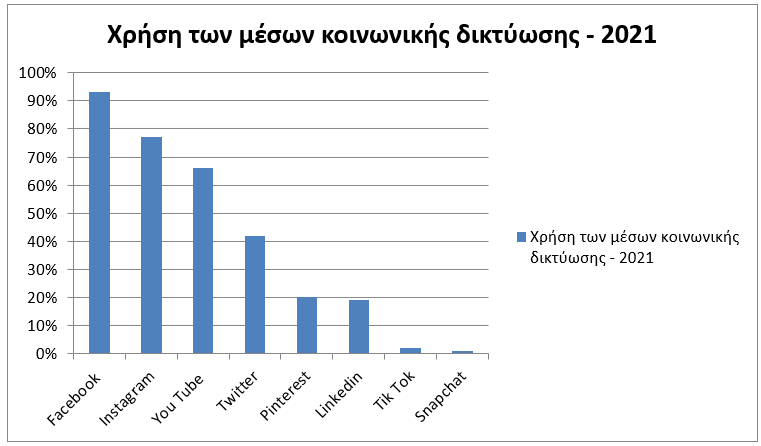
Σχήμα 2 Πηγή: EUROPE E-COMMERCE REPORT 2021
Όλες αυτές οι πληροφορίες δείχνουν ότι η πώληση μέσω των κοινωνικών μέσων δικτύωσης συνδέεται με ανατρεπτικές τεχνικές B2B και B2C.
Ξεκινώντας από τα 5 στάδια της διαδικασίας λήψης αποφάσεων[1] από τους καταναλωτές , ας δούμε πώς άλλαξαν.

- Αναγνώριση ανάγκης – είναι το σημείο στο οποίο ο καταναλωτής αναγνωρίζει το πρόβλημα, την ανάγκη ή την επιθυμία. Είναι ένας τομέας που χρησιμοποιείται λιγότερο από τις εταιρείες που, αυτή τη στιγμή, θα μπορούσαν να δημιουργήσουν την ανάγκη και να χρησιμοποιήσουν κάθε κανάλι για να φέρουν τους πελάτες στα προϊόντα τους. Η ανάγκη που εντοπίζεται συνδέεται πολύ στενά με το σημείο 5 αξιολόγησης μετά την αγορά.
Επιπλέον, για το B2B ή το B2C είναι πολύ σημαντικό να απαντηθούν δύο ερωτήσεις:
- Ποιο πρόβλημα λύνει το προϊόν ή η υπηρεσία σας;
- Είναι αρκετά εύκολο για τους πελάτες να βρουν την επωνυμία σας χρησιμοποιώντας τις συνήθεις μηχανές αναζήτησης;
Παράδειγμα: Είστε πωλητής αξεσουάρ πλεξίματος και την περίοδο της COVID-19 οι άνθρωποι αναγκάστηκαν να μείνουν στο σπίτι. Οι περισσότεροι άνθρωποι έχουν προσπαθήσει να περάσουν το χρόνο τους με διάφορα χόμπι και ένα από αυτά είναι το πλέξιμο. Έτσι, σε μια απλή αναζήτηση εμφανίζονται διάφορες επιλογές.
Στην περίπτωσή μας, τα τρία πρώτα που εμφανίστηκαν είναι: Alibaba, Made in China, Amazon.de
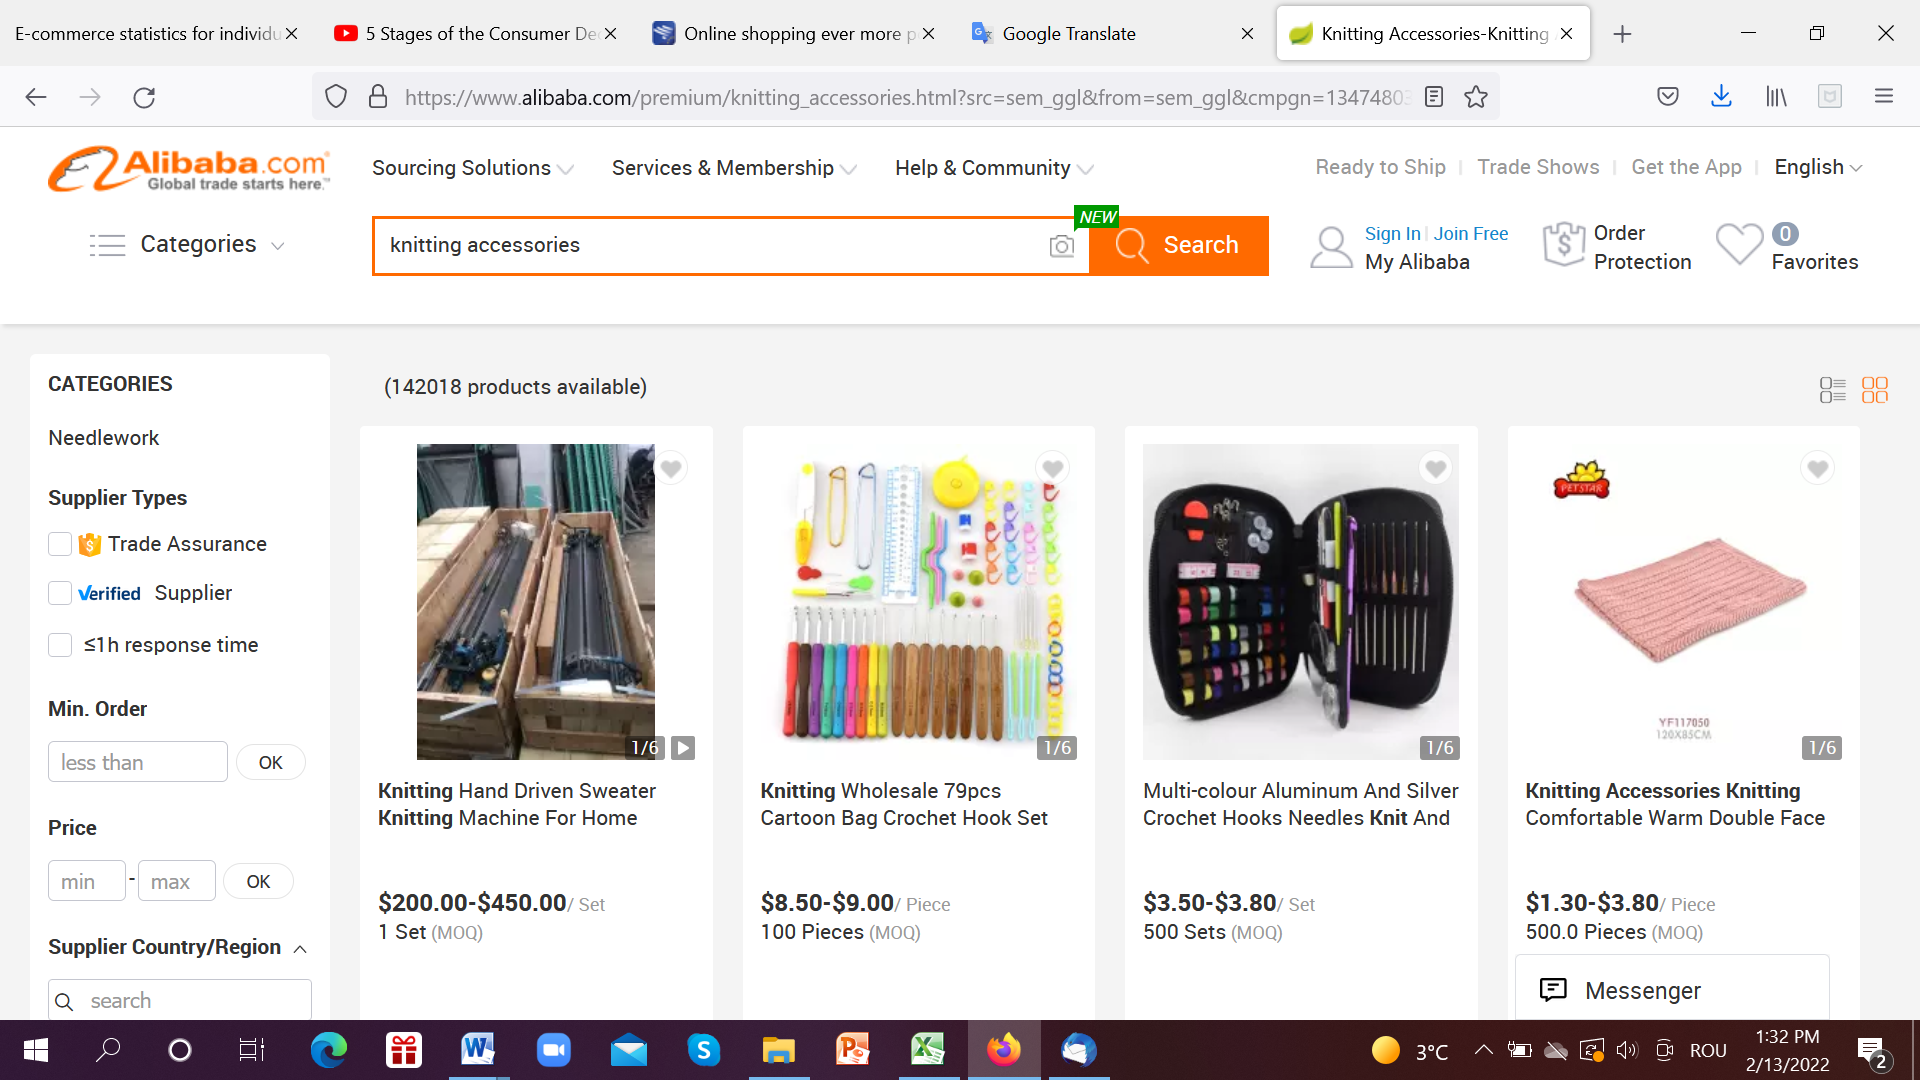
Σχήμα 3 Η επίσκεψη στη σελίδα έγινε στις 13.02.2022
- Αναζήτηση πληροφοριών – μέχρι πριν κάποια χρόνια, οι αγοραστές δεν είχαν πολλές πηγές πληροφόρησης για ορισμένα προϊόντα ή υπηρεσίες που χρειάζονταν. Ως εκ τούτου, χρησιμοποιούσαν την οικογένεια και τους συγγενείς ως πηγή, τις εφημερίδες, τα τηλεοπτικά δίκτυα και έναν μπαμπά. Σήμερα, η πληθώρα πληροφοριών γύρω μας είναι δυνατή χάρη στο Διαδίκτυο, τις ηλεκτρονικές εφαρμογές, τα κοινωνικά δίκτυα και πολλά άλλα. Για το B2C είναι μεγάλη ευκαιρία και ανάγκη να παρέχει πληροφορίες που βοηθούν τους δυνητικούς πελάτες να ενημερωθούν.
Το ερώτημα στο οποίο οι αγοραστές θέλουν να απαντήσουν είναι: Εάν χρειάζομαι ένα προϊόν από ποιο μέρος θα το αγοράσω, ποιος θα μου προσφέρει αυτό που χρειάζομαι;
Για το B2C και το B2B είναι εξαιρετικά σημαντικό να απαντηθεί αυτό το ερώτημα. Αν το καταφέρουν, αυτό είναι το σημείο όπου έρχονται τα έσοδα για την εταιρεία.
- Αξιολόγηση εναλλακτικών λύσεων – οι άνθρωποι ενδιαφέρονται να βρουν και να αγοράσουν το καλύτερο ανάμεσα στις εναλλακτικές λύσεις που έχουν. Σε αυτήν την περίπτωση δε θα κοιτάξουν τον ιστότοπό σας, τις εφαρμογές σας, αλλά θα ελέγξουν τις συστάσεις και τις κριτικές άλλων ανθρώπων. Οι εταιρείες ερευνών παρέχουν πληροφορίες στους πελάτες και οι εταιρείες πρέπει να είναι μέρος αυτής της διαδικασίας, διότι δεν ελέγχετε πλέον εσείς τι σκέφτονται οι άλλοι άνθρωποι για το προϊόν σας, αλλά οι άλλοι άνθρωποι το ελέγχουν αυτό.
- Η απόφαση αγοράς – έχοντας κατά νου τη συμπεριφορά των καταναλωτών που είναι διαφορετική με βάση τα μοντέλα αγοραστών. Ακολουθούν μερικά παραδείγματα:
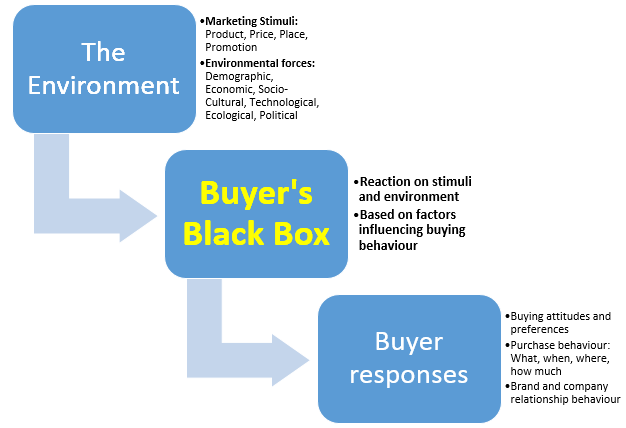
Σχήμα 4 Πηγή: https://marketing-insider.eu/buyer-black-box/
Η απόφαση του αγοραστή επηρεάζεται από πολιτιστικούς, κοινωνικούς και ψυχολογικούς παράγοντες που δεν μπορούν εύκολα να επηρεαστούν, αλλά οι B2B ή B2C πρέπει να τους γνωρίζουν.
Αυτοί είναι οι εξής:
| Πολιτιστικοί παράγοντες | Κοινωνικοί παράγοντες | Προσωπικοί παράγοντες | Ψυχολογικοί παράγοντες |
| Πολιτισμός
Υποκουλτούρα Κοινωνική τάξη |
Κοινωνικά δίκτυα
Μικρές ομάδες Οικογένεια Ρόλος & ιδιότητα |
Ηλικία και στάδιο ζωής
Επάγγελμα Οικονομική κατάσταση |
Κίνητρα
Αντίληψη Μάθηση, μνήμη και σκέψη Πεποιθήσεις & στάση |
Σχήμα 5 Πηγή: Marketing Insider, 2019 https://marketing-insider.eu/buyer-black-box/
- Αξιολόγηση μετά την αγορά – όταν μιλάμε για την αξιολόγηση της αγοράς, όπως πάντα, δεν είναι όλοι οι πελάτες ευχαριστημένοι με τα αγαθά ή τις υπηρεσίες που αγόρασαν. Η δυνατότητα επιστροφής ενθαρρύνει την αγορά. Σε αυτό το στάδιο οι B2B και B2C πρέπει να συγκεντρώσουν όσο το δυνατόν περισσότερα σχόλια για να συνειδητοποιήσουν τι είναι λάθος και να βελτιώσουν την κατάσταση.
Θεωρητικό μέρος – ΕΛΛΑΔΑ
Οι καταναλωτές στην Ελλάδα αφιερώνουν χρόνο στην αναζήτηση και χρησιμοποιούν περισσότερες διασυνδέσεις από ό,τι οι αγοραστές στην περιοχή της Κεντρικής και Ανατολικής Ευρώπης. Η IPSOS και η Google CEE1 πραγματοποίησαν δημοσκόπηση σε 4.500 πελάτες για μια ποικιλία ειδών και υπηρεσιών, όπως φορητοί υπολογιστές, τηλεοράσεις και συμβόλαια κινητής τηλεφωνίας.
Οι Έλληνες πελάτες, σε σύγκριση με τους τους αντίστοιχους πελάτες στην περιφέρεια, ξοδεύουν περισσότερο χρόνο στην αναζήτηση σε διάφορες πλατφόρμες ενώ προτιμούν να πραγματοποιούν αγορές εκτός διαδικτύου. Μεταξύ 25% και 40% των Ελλήνων πελατών δεν είχαν στο μυαλό τους μια συγκεκριμένη μάρκα κατά την έναρξη της διαδικασίας αγοράς. Είναι γεγονός ότι πολλοί πελάτες δεν είναι πιστοί σε μάρκες- μάλλον είναι αφοσιωμένοι στα προϊόντα και τις υπηρεσίες που έχουν το μεγαλύτερο νόημα γι’ αυτούς τη στιγμή της λήψης της απόφασης. Οι Έλληνες καταναλωτές είναι πιο έτοιμοι να κάνουν έρευνα σε βάθος τόσο σε διαδικτυακές πλατφόρμες όσο και σε φυσικά καταστήματα. Χρησιμοποιούν περισσότερες διεπαφές και πραγματοποιούν πολύ συχνότερη αναζήτηση σε αυτές σε σχέση με κατοίκους περιοχών της περιφέρειας.
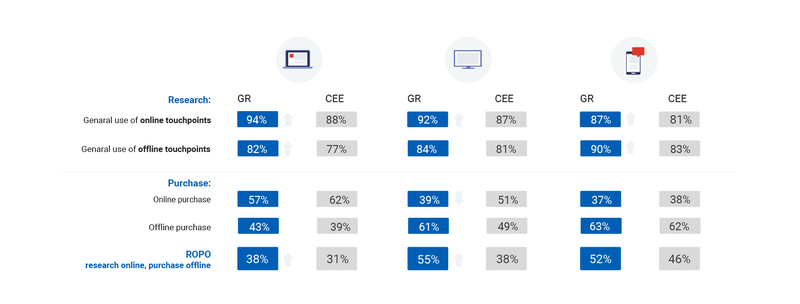
Σχήμα 6 Πηγή: Protasiuk, 2019
Οι Έλληνες είναι προσεκτικοί στην αναζήτηση ευκαιριών που ξοδεύουν το χρόνο τους ψάχνοντας σε ιστοσελίδες σύγκρισης τιμών, σε σελίδες με προδιαγραφές προϊόντων, ενώ αναζητούν ιδέες. Η πλειονότητα των πελατών συγκρίνει το κόστος και αναζητά προσφορές, αλλά ένα σημαντικό ποσοστό αναζητά έμπνευση και τι υπάρχει στην αγορά (Protasiuk, 2019).
Όσον αφορά την περίοδο COVID-19, οι Έλληνες έχουν αλλάξει ελαφρώς τις αγοραστικές τους συνήθειες. Τα ευρήματα της έρευνας Future Consumer Index Greece 2021 δείχνουν σαφώς ότι τα άτομα δεν καταναλώνουν απλώς περισσότερα είδη και υπηρεσίες στο σπίτι. Ολόκληρη η ζωή τους αναδιαμορφώνεται γύρω από το σπίτι τους.
Οι καταναλωτές στην Ελλάδα ανησυχούν περισσότερο για τις οικονομικές επιπτώσεις της πανδημίας. Ως αποτέλεσμα, τα άτομα προτιμούν να ξοδεύουν λιγότερα σήμερα, αγοράζοντας μόνο τα απολύτως απαραίτητα και αποταμιεύοντας περισσότερα. Κατά τα επόμενα τρία χρόνια, η τάση αυτή είναι απίθανο να αλλάξει. Μακράν ο σημαντικότερος παράγοντας αγοράς θα παραμείνει η τιμή. Οι Έλληνες θα συνεχίσουν να ξοδεύουν το ίδιο ποσό για τα περισσότερα πράγματα σε σχέση με αυτό που ξόδευαν κατά τη διάρκεια της πανδημίας, και στις λίγες περιπτώσεις όπου θα τροποποιήσουν τις δαπάνες τους, αυτό θα γίνει κυρίως προς τα κάτω. Πολλοί πελάτες δηλώνουν ότι είναι διατεθειμένοι να πληρώσουν περισσότερα για προϊόντα που έχουν μοναδικά χαρακτηριστικά. Μεταξύ αυτών συγκαταλέγονται τα είδη που κατασκευάζονται στην Ελλάδα, τα προϊόντα υψηλής ποιότητας και τα προϊόντα που προσφέρουν άνεση, πρακτικότητα και ευκολία. Από την άλλη πλευρά, η προθυμία των καταναλωτών να πληρώσουν ένα premium για ένα προϊόν διαφέρει σημαντικά μεταξύ των δημογραφικών ομάδων (Μαύρος, 2021).
Κοινωνικές αγορές στην Ελλάδα
Οι υπηρεσίες κοινωνικού εμπορίου, όπως ο Commerce Manager του Facebook για πωλήσεις στο Facebook και το Instagram, δεν είναι προς το παρόν διαθέσιμες στην Ελλάδα (Synergic, 2020).
Σύμφωνα με έρευνα της NielsenIQ σε 850 Έλληνες που έψαξαν στο διαδίκτυο τον περασμένο Σεπτέμβριο-Οκτώβριο, 6 στους 10 δήλωσαν ότι έχουν ήδη αγοράσει από ηλεκτρονικά καταστήματα, μέσω πλατφορμών κοινωνικής δικτύωσης, με τις νέες ηλικίες να παραμένουν ο κύριος μοχλός ανάπτυξης του καναλιού. Το Facebook παραμένει η πιο δημοφιλής πλατφόρμα για την αγορά αγαθών μέσω κοινωνικών δικτύων, με το 52% των online αγοραστών στην Ελλάδα να το χρησιμοποιεί για το σκοπό αυτό. Ακολουθεί το Instagram, το οποίο προτιμάται από τη νέα γενιά (18-24 ετών) – με σχεδόν τους μισούς (49%) των ερωτηθέντων αυτής της ομάδας να δηλώνουν ότι χρησιμοποιούν το Instagram για online αγορές.
Σχήμα 7 Πηγή: Synergic, 2020
Η άνοδος του κοινωνικού εμπορίου συνδέεται με την αύξηση της χρήσης των μέσων κοινωνικής δικτύωσης και του μέσου χρόνου που περνούν ορισμένοι άνθρωποι σε αυτά. Στην Ελλάδα, 7 στους 10 Έλληνες δήλωσαν ότι αύξησαν τον χρόνο που περνούσαν στα μέσα κοινωνικής δικτύωσης από την έναρξη του λουκέτου από τον περασμένο Μάρτιο μέχρι σήμερα (Gkitsi, 2021). Ο αυξανόμενος χρόνος που αφιερώνουν οι περισσότεροι άνθρωποι, ιδίως οι νεότερες γενιές, στις εφαρμογές των μέσων κοινωνικής δικτύωσης έχει καταστήσει το κοινωνικό εμπόριο μια αδιαμφισβήτητη τάση για το ηλεκτρονικό εμπόριο τα επόμενα χρόνια. Εξίσου σημαντική είναι η αναδυόμενη προτίμηση των νέων χρηστών στις πλατφόρμες κοινωνικής δικτύωσης με κύριο περιεχόμενο το βίντεο και τις φωτογραφίες. Το γεγονός αυτό επιβεβαιώνεται από το σημαντικό ποσοστό των νέων που μετακινούνται από το Facebook σε πλατφόρμες όπως το ΥouTube, το Ιnstagram και το Snapchat. Πρόκειται για μια πολύ σημαντική παράμετρο που οι εταιρείες θα πρέπει να συμπεριλάβουν στην προετοιμασία της στρατηγικής μάρκετινγκ για τα επόμενα χρόνια (Synergic, 2020).
Βιβλιογραφικές αναφορές
Gkitsi, A. (2021). Ξεχάστε τα eshops, ζήτω το Social Commerce. (Forget eshops, long live Social Commerce) Capital.gr. Ανακτήθηκε στις 10 Φεβρουαρίου 2022, από https://www.capital.gr/epixeiriseis/3526791/xexaste-ta-eshops-zito-to-social-commerce
Mavros, T. (10 Ιουνίου 2021). As Greek consumers keep adapting, how ready is your business to respond? EY US – Ανακτήθηκε στις 10 Φεβρουαρίου 2022, από https://www.ey.com/en_gr/future-consumer-index/as-greek-consumers-keep-adapting-how-ready-is-your-business-to-respond
Protasiuk, M. (2019). Particularly greek: The modern path to purchase in Greece. Google. Ανακτήθηκε στις 10 Φεβρουαρίου 2022, από https://www.thinkwithgoogle.com/intl/en-cee/consumer-insights/consumer-journey/particularly-greek-modern-path-purchase-greece/
Synergic. (1 Απριλίου 2020). To Ηλεκτρονικό Εμπόριο σήμερα, eCommerce trends. (The E-Commerce today. E-Commerce Trends) Ανακτήθηκε στις 10 Φεβρουαρίου 2022, από https://synergic.gr/el/ilektroniko-emporio-ecommerce-b2b-b2c
Θεωρητικό μέρος – ΡΟΥΜΑΝΙΑ
Σύμφωνα με τη Eurostat (2021), τα υψηλότερα ποσοστά χρηστών του διαδικτύου που αγόρασαν ή παρήγγειλαν αγαθά ή υπηρεσίες μέσω του διαδικτύου κατά τους 12 μήνες πριν από την έρευνα καταγράφηκαν στις Κάτω Χώρες (94%), τη Δανία (92%) και τη Σουηδία (89%). Από την άλλη πλευρά, λιγότερο από το 50% είχε ψωνίσει μέσω διαδικτύου στη Ρουμανία (45%) και τη Βουλγαρία (42%).
Με βάση την έκθεση EUROPE E-COMMERCE REPORT 2021,
- Ο ρυθμός ανάπτυξης της Ρουμανίας (B2C) είναι 30% σε σύγκριση με το GR -77%,
- Ηλεκτρονικό ΑΕΠ Ρουμανίας 3,51% σε σύγκριση με GR 6,65% και Δανία 7,29%.
- ΣΥΧΝΟΤΗΤΑ ΑΓΟΡΩΝ ΣΤΟ ΔΙΑΔΙΚΤΥΟ ΤΟ ΤΕΛΕΥΤΑΙΟ ΤΡΙΜΗΝΟ, 2020, Ρουμανία –
- 2% έξι φορές ή περισσότερο
- 10% 3 έως 5 φορές
- 14% 1-2 φορές
- ΗΛΕΚΤΡΟΝΙΚEΣ ΑΓΟΡEΣ ΣΕ ΕΘΝΙΚO ΚΑΙ ΔΙΑΣΥΝΟΡΙΑΚO ΕΠIΠΕΔΟ, ΤΡΕΙΣ ΜHΝΕΣ, 2020
- From national sellers – 97% Από εθνικούς πωλητές = 97%
- Από πωλητές από άλλες χώρες της ΕΕ -10 %
- Από πωλητές από τον υπόλοιπο κόσμο (χώρες εκτός ΕΕ) – 4%
- Από πωλητές από άγνωστες χώρες – 2%
- Από πωλητές από άλλες χώρες (ΕΕ ή εκτός ΕΕ) – 1,2%
Υπάρχει μια σαφής προσέγγιση με βάση τη συμπεριφορά των Ρουμάνων πελατών. Το έτος 2020 ήταν το πρώτο έτος των αυστηρών περιορισμών του COVID 19 και οι πελάτες άρχισαν να αγοράζουν μέσω διαδικτύου λόγω των λιγότερων φυσικών καταστημάτων, ο αριθμός των οποίων μειονώταν σχεδόν όλο το έτος.
Εκτιμάται, για τον τομέα του ηλεκτρονικού εμπορίου – ότι ξεπέρασε το όριο των 5,6 δισεκατομμυρίων ευρώ στο τέλος του 2020, 30% περισσότερο από ό, τι το 2019, όταν η αξία του ηλεκτρονικού εμπορίου εκτιμήθηκε σε 4,3 δισεκατομμύρια ευρώ[1]. Οι συναλλαγές που πραγματοποιήθηκαν αντιπροσωπεύουν μόνο τον τομέα του ηλεκτρονικού εμπορίου και δεν περιλαμβάνουν υπηρεσίες, λογαριασμούς κοινής ωφέλειας, ψηφιακό περιεχόμενο ή αεροπορικά εισιτήρια, διακοπές & ταξίδια, κρατήσεις ξενοδοχείων, εισιτήρια παραστάσεων ή άλλων εκδηλώσεων. Το φαγητό ήταν μία από τις δημοφιλέστερες αγορές και το Food Panda ήταν ο βασικός πρωταγωνιστής.
Ωστόσο, όταν συζητάμε για τη συμπεριφορά του Ρουμάνου αγοραστή, πρέπει επίσης να λάβουμε υπόψη τον τρόπο πληρωμής του. Ο Ρουμάνος αγοραστής αισθάνεται πιο ικανοποιημένος όταν πληρώνει τη στιγμή που παραλαμβάνει τα προϊόντα. Η πανδημία έχει τεράστια επίδραση στη χρήση μετρητών στη Ρουμανία[2]. “Ο αριθμός των ανθρώπων που πληρώνουν με φυσικό χρήμα μειώθηκε από 45% σε 21%. Εν τω μεταξύ, η δημοτικότητα των ανέπαφων καρτών έφτασε το 59%. “Αλλά ο Ρουμάνος καταναλωτής εξακολουθεί να αισθάνεται ασφαλής μόνο όταν πληρώνει με μετρητά κατά την παράδοση του προϊόντος.
Οι λόγοι που οδηγούν στη συγκεκριμένη επιλογή μπορεί να είναι[3]:
- Είναι πιο βολικό – 59,6%
- Δεν υπήρχε άλλος διαθέσιμος τρόπος – 42,5%
- Είναι ασφαλές – 28,3%
- “Αληθινό ηλεκτρονικό εµπόριο” σημαίνει επίσης ηλεκτρονικές συναλλαγές – 25,9%
- Άλλο – 2,4%
Η συμπεριφορά των πελατών στη Ρουμανία αλλάζει. Ενώ πέρυσι η ανάπτυξη των έργων ηλεκτρονικού εμπορίου προήλθε από τον κλάδο της μόδας, ακολουθούμενο από τους κλάδους της πληροφορικής και των ηλεκτρικών συσκευών και του DIY, οι μεγαλύτερες αυξήσεις κατά το τρέχον έτος είναι πιθανό να αναφερθούν από κλάδους όπως το λιανικό εμπόριο και η διανομή προϊόντων, η εφοδιαστική αλυσίδα και οι μεταφορές, η τεχνολογία, αλλά και η υγεία.
Βιβλιογραφικές αναφορές
Understanding consumer behaviour, from the inside out, https://www.youtube.com/watch?v=XowaDm1GEVk
Understanding consumer behavior, consumer behavior definition, basics, and best practices:
https://www.youtube.com/watch?v=jP3XVgrSNsM
CHAPTER 1 – What is Consumer Behavior, https://www.youtube.com/watch?v=gtfPU6nTa9k
Consumer Behavior with Michael Solomon:
https://www.youtube.com/watch?v=TfK6nawMEp0
Stages of the Consumer Decision-Making Process and How it’s Changed https://www.youtube.com/watch?v=a9lpVg54u-k
The Buyer Black Box – Buyer’s Characteristics – Factors influencing the Consumer Buying Behaviour https://marketing-insider.eu/buyer-black-box/ visited 13.02.2022
Steven Hob Four Types of Buying Behaviour:
https://www.youtube.com/watch?v=Bnrdv-7ndFo, 13.02.2022
Live Shopping, Direct-to-Consumer și comerțul conversațional, printre cele mai importante tendințe în e-commerce în 2022 – Roxana Vasile:
Θεωρητικό μέρος – ΠΟΛΩΝΙΑ
Οι κοινωνικές πωλήσεις θα αναπτυχθούν σίγουρα με πολύ γρήγορους ρυθμούς τα επόμενα χρόνια. Πρόκειται αναμφίβολα για μια νέα τάση που έχει επιταχυνθεί, μεταξύ άλλων, ως αποτέλεσμα της πανδημίας του Covid-19. Η πλειονότητα, έως και το 86% των αγοραστών, είναι ικανοποιημένοι από τις συναλλαγές που έχουν πραγματοποιηθεί μέχρι στιγμής και περισσότεροι από τους μισούς δηλώνουν ότι θα επαναλάβουν τις αγορές με αυτή τη μορφή στο άμεσο μέλλον.
Σύμφωνα με την έκθεση: “The power of social & live commerce report”, που πραγματοποιήθηκε το 2021 από το Ίδρυμα γυναικών που ασχολούνται με ηλεκτρονικό εμπόριο, φάνηκε ότι το 27% των Πολωνών πραγματοποιούν αγορές από τα μέσα κοινωνικής δικτύωσης. Κάθε ένας στους τέσσερις Πολωνούς πραγματοποίησε μια αγορά κατά τη διαδικασία ζωντανών μεταδόσεων (live) στα μέσα κοινωνικής δικτύωσης, συμπεριλαμβανομένου του 10% που ψωνίζει συχνά με αυτόν τον τρόπο. Υπολογίζεται ότι το 18% των Πολωνών πωλούν μέσω των κοινωνικών μέσων ενημέρωσης.
Έτσι προκύπτει ότι αξίζει να ελέγξει κανείς αυτή τη μέθοδο πώλησης όταν πρόκειται να εισέλθει στην πολωνική αγορά και στοχεύει στους Πολωνούς καταναλωτές.
Ποιος αγοράζει και πουλάει περισσότερο στα μέσα κοινωνικής δικτύωσης; Κυρίως νεαρές γυναίκες έως 34 ετών από μικρότερες πόλεις και χωριά. Ως εκ τούτου, τα μηνύματα και τα προϊόντα θα πρέπει να απευθύνονται πρωτίστως σε αυτές.
Πού πραγματοποιούνται συχνότερα οι συναλλαγές; Μέσω του Facebook.
Τι αγοράζουν οι Πολωνοί συχνότερα μέσω των μέσων κοινωνικής δικτύωσης; Οι πιο δημοφιλείς κλάδοι χάρη στους οποίους το κοινωνικό εμπόριο στην Πολωνία ενισχύεται ολοένα και περισσότερο είναι οι εξής: είδη ένδυσης και υπόδησης (τα οποία το 45% των Πολωνών αγόρασε μέσω των μέσων κοινωνικής δικτύωσης και το 41% έχει εμπειρία πώλησης αυτής της ποικιλίας σε αυτό το κανάλι), βιβλία, CD και ταινίες (αντίστοιχα: 27% και 23%), καλλυντικά / αρώματα (27% και 18%) και παιδικά είδη και παιχνίδια (24% και 17%).
Και τι τους αποθαρρύνει από το να αγοράζουν ή να πουλούν μέσω των μέσων κοινωνικής δικτύωσης; Οι αγοραστικές συνήθειες που σχετίζονται με την επιλογή των σταθερών καταστημάτων, τη δυνατότητα να αγγίξετε ή να δείτε ζωντανά ένα συγκεκριμένο προϊόν. Σημαντικός αποτρεπτικός παράγοντας είναι η ανησυχία για την ασφάλεια και την ποιότητα των συναλλαγών (απάτη, προβλήματα με καταγγελίες κ.λπ.).
Γιατί οι Πολωνοί αποφασίζουν να κάνουν αγορές μέσω των μέσων κοινωνικής δικτύωσης; Επειδή θεωρούν ότι αυτή η λύση είναι απλή, γρήγορη και βολική, προσαρμοσμένη στις προσωπικές τους ανάγκες και επιπλέον, σας επιτρέπει να επιλέξετε μια ευνοϊκή τιμή, επηρεάζοντας έτσι την εξοικονόμηση χρημάτων.
Οι αγορές που πραγματοποιούνται κατά τη διάρκεια των λεγόμενων ζωντανών μεταδόσεων προσελκύουν όλο και συχνότερα τους Πολωνούς πελάτες, προσελκύοντας το ενδιαφέρον από άποψη είδους και τιμής, αλλά κυρίως προσελκύουν συναισθηματικά τους καταναλωτές. Πρόκειται για μια μορφή αγορών που αρέσει στους καταναλωτές (42%) και προκαλεί εθισμό (σύμφωνα με το 39%). Ως εκ τούτου, είναι καλό να εξετάσετε το ενδεχόμενο να εισαγάγετε αυτό το είδος παρουσίασης προϊόντων ή υπηρεσιών.
Πώς αρέσει στους Πολωνούς να αγοράζουν; Κατά προτίμηση στα μέσα κοινωνικής δικτύωσης, επικοινωνώντας απευθείας με τον πωλητή ή κάνοντας κλικ σε συνδέσμους που ανακατευθύνουν σε πλατφόρμες πωλήσεων και ηλεκτρονικά καταστήματα. Γι’ αυτό αξίζει κάποιος να πραγματοποιήσει δραστηριότητες σύμφωνα με τις αρχές της συστηματικής και αξιόπιστης επικοινωνίας μέσω άμεσων μηνυμάτων, καθώς και να διασφαλίσει την ποιότητα της σελίδας στην οποία θα οδηγήσει η ανακατεύθυνση από τα μέσα κοινωνικής δικτύωσης.
Πόσο συχνά αγοράζουν οι Πολωνοί; Αγοράζουν τουλάχιστον 2-3 χρόνια (39%), τουλάχιστον μία φορά τον μήνα (47%), κυρίως μέσω smartphone. Ως εκ τούτου, κάποιος που ασχολείται με το ηλεκτρονικό εμπόριο δεν θα πρέπει να ξεχνά πόσο σημαντική είναι η κατάλληλη ανταπόκριση και η προσαρμογή των μηνυμάτων στα smartphones από την άποψη της τεχνολογίας και της συχνότητας αποστολής τους, αναμένοντας ότι οι τακτικοί πελάτες θα αγοράσουν από εκείνους μία φορά το μήνα.
Πόσα μπορεί να δαπανήσει ένας μέσος Πολωνός για μια εφάπαξ συναλλαγή που πραγματοποιείται μέσω των μέσων κοινωνικής δικτύωσης; Κατά μέσο όρο, οι αγορές αυτές δαπανώνται μεταξύ 50 και 200 ζλότι (PLN) (41%). Πρόκειται για μια σημαντική ένδειξη κατά την τιμολόγηση μεμονωμένων προϊόντων και υπηρεσιών.
Προσοχή! Για να επιτύχετε κερδοφόρες πωλήσεις σε Πολωνούς πελάτες είναι σημαντικό να θυμάστε ότι οι Πολωνοί πληρώνουν πιο άμεσα και πιο συχνά με BLIK σε τέτοιες συναλλαγές. Χωρίς τη δυνατότητα χρήσης της πληρωμής μέσω BLIK, είναι πολύ πιθανό ένας δυνητικός πελάτης να αλλάξει γνώμη, καθώς πιστεύει ότι μια συνήθης μεταφορά του ποσού απαιτεί πολύ περισσότερο χρόνο.
Επίσης πρέπει να δοθεί προσοχή και στη μέθοδο αποστολής. Πολλοί Πολωνοί προτιμούν να στέλνουν σε μηχανές δεμάτων, σε προσιτή τιμή γύρω στα 8 ζλότι (PLN) ή φθηνότερα. Η ανάγκη για την παραλαβή του δέματος από τον ίδιο τον πελάτη ή το υψηλό κόστος των μεταφορικών μπορεί να αποδειχθούν “αποτρεπτικοί παράγοντες” και να αποθαρρύνουν έναν δυνητικό πελάτη από την αγορά.
Λίγα λόγια για τις πωλήσεις στο πλαίσιο των κοινωνικών πωλήσεων στην Πολωνία από Πολωνούς πωλητές.
Γιατί αξίζει να εξετάσετε αυτή τη μορφή πώλησης στην Πολωνία; Επειδή είναι φθηνή και εύκολη για τον πωλητή και επιπλέον σας επιτρέπει να προσεγγίσετε καλύτερα την ομάδα-στόχο.
Πώς μπορεί κάποιος να πουλά συχνότερα; Για παράδειγμα, με την τοποθέτηση φωτογραφιών προϊόντων/ υπηρεσιών σε συνδυασμό με μια περιγραφή ή μια ενημερωτική ανάρτηση. Οι Πολωνοί πωλητές χρησιμοποιούν συχνά το Facebook Marketplace, το Instagram Shop και τις εξωτερικές υπηρεσίες διαφήμισης και τις πύλες δημοπρασιών.
Πώς να προσεγγίσετε αποτελεσματικότερα τους δυνητικούς πελάτες; Τα πιο συχνά χρησιμοποιούμενα μέσα για το σκοπό αυτό είναι οι προωθούμενες αναρτήσεις και το μάρκετινγκ από στόμα σε στόμα, δηλαδή ένα σύστημα προτάσεων και συστάσεων από φίλους.
Τι είδους αποτέλεσμα στις πωλήσεις πρέπει να περιμένει κάποιος που χρησιμοποιεί τις παραπάνω μεθόδους; Κατά μέσο όρο, πραγματοποιούνται έως και 10 συναλλαγές/μήνα, οπότε το εισόδημα από τις πωλήσεις μέσω των μέσων κοινωνικής δικτύωσης είναι περισσότερο μια πρόσθετη πηγή εισοδήματος παρά ένας τρόπος για την απόκτηση τακτικών αποδοχών – το συνηθέστερο μέσο μηνιαίο εισόδημα από τις πωλήσεις μέσω των μέσων κοινωνικής δικτύωσης δεν υπερβαίνει τα 1.000 PLN (31%). Ωστόσο, λαμβάνοντας υπόψη τον τρόπο με τον οποίο αναπτύσσεται αυτή η μέθοδος πωλήσεων και το γεγονός ότι η ίδια η τεχνική πωλήσεων είναι εύκολη και γρήγορη και προσεγγίζει δυνητικούς πελάτες, αξίζει να τη χρησιμοποιήσει κανείς.
Η βασική πρόκληση είναι ο έντονος ανταγωνισμός και, ως εκ τούτου, η αποτελεσματική προώθηση του καταστήματος/πωλητή για την καλύτερη προσέγγιση του πελάτη.
Ο πιο δημοφιλής ιστότοπος κοινωνικής δικτύωσης μέσω του οποίου οι Πολωνοί πραγματοποιούν αγορές ή πωλήσεις είναι το Facebook. Λίγο πάνω από το 80% των ατόμων που αγοράζουν ή πωλούν μέσω του κοινωνικού εμπορίου χρησιμοποιούν αυτόν τον ιστότοπο για τους σκοπούς αυτούς. Οι ανταγωνιστικές πλατφόρμες βρίσκονται πολύ πίσω, αν και έχουν και αυτές τους υποστηρικτές τους. Εκτός από το Facebook, το κοινωνικό εμπόριο είναι επίσης αισθητό στο Instagram και το YouTube. Οι Πολωνοί συμπεριέλαβαν αυθόρμητα ιστότοπους κοινωνικής δικτύωσης όπως το Vinted, το OLX ή το Allegro. Λίγοι Πολωνοί, ωστόσο, πραγματοποιούν αγορές στο TikTok, το Snapchat ή το Pinterest (περίπου 7%, και 82% από το Facebook).
Τι πρέπει να θυμάστε όταν σχεδιάζετε μια στρατηγική προώθησης στα μέσα κοινωνικής δικτύωσης στην Πολωνία;
Τα μέσα κοινωνικής δικτύωσης αποτελούν αναπόσπαστο μέρος της ζωής πολλών Πολωνών, γεγονός που σίγουρα ευνοεί την ανάπτυξη των κοινωνικών πωλήσεων στη χώρα αυτή. Το 71% των ερωτηθέντων χρησιμοποιεί τους ιστότοπους κοινωνικής δικτύωσης για τουλάχιστον 5 χρόνια, χρησιμοποιώντας τους πρακτικά όλο το εικοσιτετράωρο – από τις πρώτες πρωινές έως τις τελευταίες βραδινές ώρες. Αυτό δείχνει ότι τα μέσα κοινωνικής δικτύωσης έχουν καθιερωθεί στη ζωή μας, γεμίζοντας κάθε “πιο χαλαρή” στιγμή της ημέρας.
Οι ιστότοποι κοινωνικής δικτύωσης δέχονται τις περισσότερες επισκέψεις το βράδυ – μεταξύ 6.00 μ.μ. και 10.00 μ.μ. – κάθε ένας στου δύο ερωτηθέντες (53%) χρησιμοποιεί συχνότερα τα μέσα κοινωνικής δικτύωσης κατά τις ώρες αυτές, γεγονός που μπορεί να δείχνει ότι αντιμετωπίζονται ως “ψυχαγωγία” / χαλάρωση μετά από όλη την ημέρα, καθώς και για να ενημερωθούμε για το τι συμβαίνει με τους φίλους μας ή τα άτομα που ακολουθούμε.
Τα παραπάνω συμπεράσματα απεικονίζουν αρκετά καλά πόσο ισχυρές είναι οι δυνατότητες του κοινωνικού εμπορίου και πόσο αποτελεσματικό μπορεί να αποδειχθεί αυτό το κανάλι πωλήσεων – δεδομένου ότι χρησιμοποιούμε τις ιστοσελίδες κοινωνικής δικτύωσης συνεχώς εδώ και αρκετά χρόνια, όλη την ημέρα, είναι μια πιθανότητα / πειρασμός να κάνουμε γρήγορα, προσαρμοσμένες στις ανάγκες και τις προτιμήσεις μας για αγορές, οι οποίες γίνονται “κατά την περιήγηση” στην δικτυακή πλατφόρμα, είναι αρκετά υψηλές.
Βιβλιογραφικές αναφορές
Social Media w Polsce 2021 – raport, https://empemedia.pl/social-media-w-polsce-2021-nowy-raport/
Social Media jako platforma e-commerce. Nowy raport the power of social & live commerce. https://www.kobietyebiznesu.pl/social-media-jako-platforma-e-commerce-nowy-raport-the-power-of-social-live-commerce/
The power of social & live commerce https://www.przelewy24.pl/dla-mediow/social-media-jako-platforma-e-commerce-raport-power-social-live-commerce
https://socialpress.pl/kategoria/raporty
Θεωρητικό μέρος – ΣΚOΤΙΑ
Το Ηνωμένο Βασίλειο αποτελεί μία κοινωνία μαζικής κατανάλωσης, παρόλο που η οικολογική και υπεύθυνη κατανάλωση αυξάνεται και οι ηθικές και περιβαλλοντικές επιχειρηματικές πρακτικές αποκτούν ολοένα και μεγαλύτερη σημασία. Ειδικά μετά την πανδημία και τους περιορισμούς, το ηλεκτρονικό εμπόριο γίνεται μια πολύ σημαντική αγορά. 6 στους 10 Βρετανούς δίνουν προσοχή στην προέλευση των προϊόντων (Export Entreprises SA, 2022).
Μόνο το 2020, 6 στους 10 Βρετανούς καταναλωτές είχαν αγοράσει τουλάχιστον ένα ρούχο μέσω διαδικτύου τους τελευταίους 12 μήνες, καθιστώντας τα ρούχα την πρώτη τους επιλογή. Ακολουθούν τα ηλεκτρονικά είδη, τα καλλυντικά κ.λπ. (D. Tighe, 2021)
Πριν προβούν σε μια αγορά, πάνω από το 60% των αγοραστών αναζητούν το προϊόν ή παρόμοιο προϊόν στο διαδίκτυο, διαβάζοντας κριτικές από προηγούμενους πελάτες.
Το 90% δήλωσε επίσης ότι συνήθως αποφεύγει να αγοράσει από μια εταιρεία με βαθμολογία 4 αστέρων, καθιστώντας απαραίτητο για τα ηλεκτρονικά καταστήματα να παρέχουν ποιοτικά προϊόντα και υπηρεσίες φιλικές προς τον πελάτη. (D. Tighe, 2021).
[1] https://www.gpec.ro/blog/en/gpec-romanian-e-commerce-2020-report-5-6-billion-euro-worth-of-online-shopping-a-30-yoy-growth
[2] https://ecommercenews.eu/popular-payment-methods-in-europe-in-2022/
[3] Romanian Consumer Behaviour and Payment Choice
in Online Shopping. A Marketing Perspective
Mihaela CONSTANTINESCU*, Andreea ORINDARU, Daniela IONIȚĂ, Ștefan-Claudiu CĂESCU, DOI: 10.2478/9788366675162-006

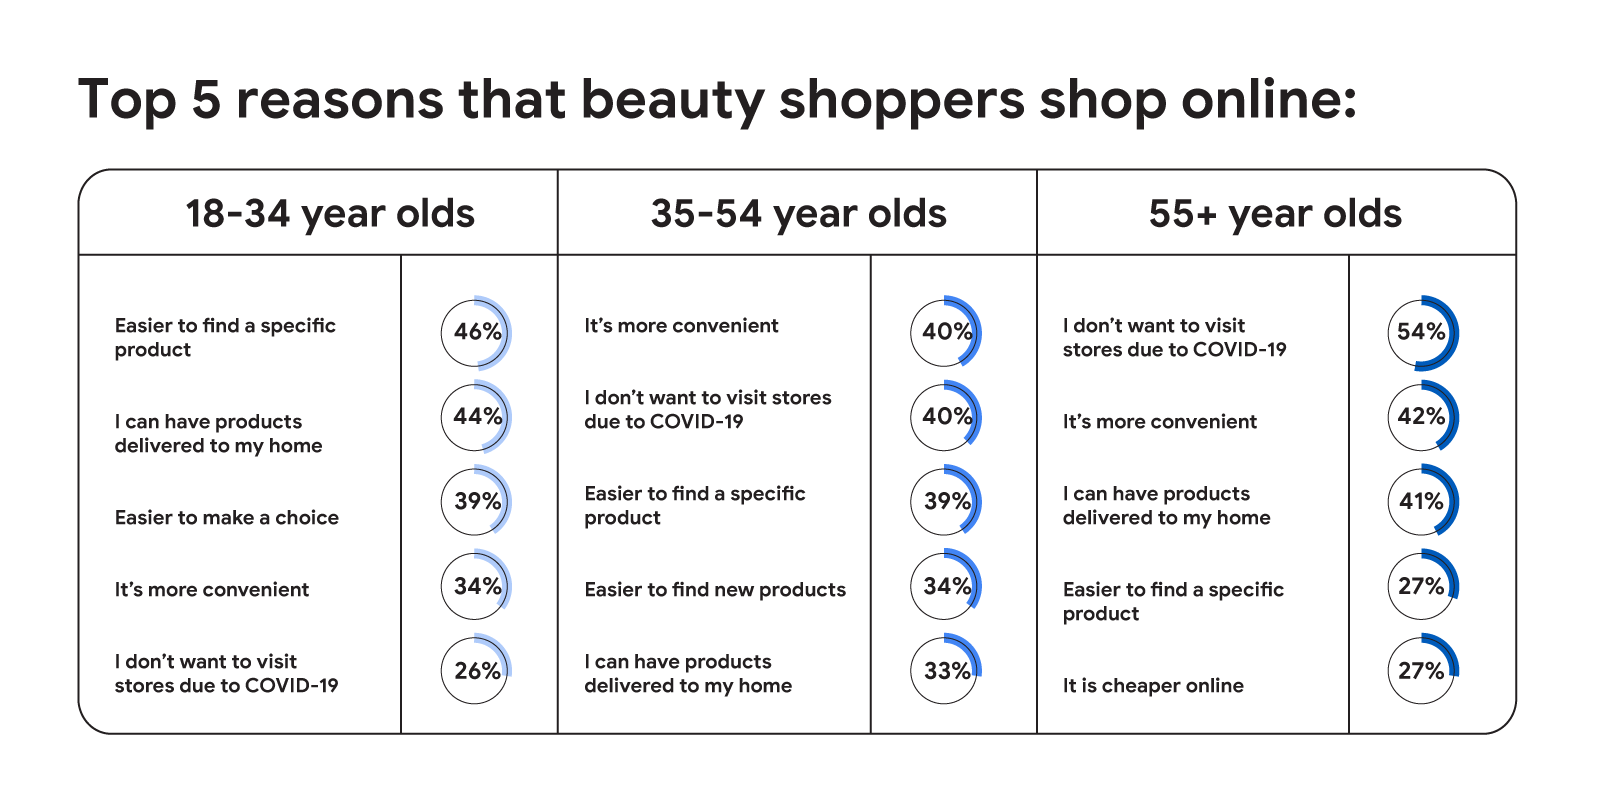
Φυσικά, η πανδημία είχε σημαντικό αντίκτυπο στο παγκόσμιο εμπόριο. Στο Ηνωμένο Βασίλειο, το 70% των Βρετανών ερωτηθέντων δήλωσε ότι οι ηλεκτρονικές αγορές τους αυξήθηκαν σε σύγκριση με την περίοδο πριν από την πανδημία. Ακόμη και πριν από την πανδημία, οι ηλεκτρονικές αγορές στη Βρετανία, κυρίως σε ηλεκτρονικά είδη, ήταν σε υψηλά ποσοστά. Ο κύριος τομέας στον οποίο παρατηρήθηκε αλλαγή ήταν η αγορά ρούχων, με 28% περισσότερους καταναλωτές να προτιμούν να αγοράζουν ρούχα ηλεκτρονικά, σε σύγκριση με την περίοδο πριν από την πανδημία (Justine L’Estrange, Emily Allen, 2021). Παράλληλα, αυξήθηκε το ηλικιακό εύρος των πελατών που πραγματοποιούν ηλεκτρονικές αγορές. Βέβαια, η πανδημία δεν άλλαξε εντελώς τον τρόπο που επιλέγουν να ψωνίζουν. Όπως φαίνεται στον παρακάτω πίνακα, για παράδειγμα στον τομέα της ομορφιάς, η πανδημία δεν καταλαμβάνει υψηλές θέσεις στην κατάταξη. Επίσης, η ίδια έρευνα που διεξήχθη σε συνεργασία με την Google και την Trinity McQueen δείχνει ότι αυτή τη στιγμή, ακόμη και σε νεαρή ηλικία, προτιμάται ένα υβριδικό μοντέλο αγορών. (Justine L’Estrange, Emily Allen, 2021)
Για τους εμπόρους:
- Τα παραπάνω στοιχεία δείχνουν ότι ακόμη και αν το λιανικό εμπόριο αποτελεί προτεραιότητα, η εικόνα μιας επιχείρησης στο διαδίκτυο είναι πολύ σημαντική και σε καμία περίπτωση δεν πρέπει να παραμελείται (Justine L’Estrange, Emily Allen, 2021).
- Να είστε ανταγωνιστικοί ως προς την τιμή. Το 35% των καταναλωτών στο Ηνωμένο Βασίλειο χρησιμοποιεί ιστοσελίδες σύγκρισης για το σκοπό αυτό (WordBank).
- Δημιουργήστε εμπιστοσύνη με τους πελάτες σας. Το 65% των καταναλωτών του Ηνωμένου Βασιλείου δηλώνουν πιστοί αγοραστές – πάνω από τον παγκόσμιο μέσο όρο του 61%. Επίσης είναι δημοφιλή τα προγράμματα επιβράβευσης. Το 73% των 18-24 ετών στη Βρετανία πιστεύει ότι είναι ένας καλός τρόπος για τις εμπορικές μάρκες να ανταμείβουν τους πελάτες (WordBank).
- Επικεντρωθείτε στο πρότυπο του τρόπου ζωής που προωθεί η επωνυμία (WordBank).
Σχήμα 8 Οι αλλαγές στις αγορές: Τα στοιχεία που αποκαλύπτουν τις μόνιμες αλλαγές στη συμπεριφορά των καταναλωτών στο Ηνωμένο Βασίλειο, Justine L’Estrange, Emily Allen
Κοινωνικό Εμπόριο
Οι αγορές μέσω των μέσων κοινωνικής δικτύωσης αυξάνονται στο Ηνωμένο Βασίλειο. Σχεδόν το ένα τέταρτο των αγοραστών στο Ηνωμένο Βασίλειο χρησιμοποιεί τα μέσα κοινωνικής δικτύωσης για να εντοπίσει νέα προϊόντα, σύμφωνα με την ετήσια εμπειρία των αγοραστών του 2021 της αμερικανικής εταιρείας λογισμικού Bazaarvoice. (Jessica Paige, 6 Μαΐου 2021). Οι κοινωνικές αγορές πραγματοποιούνται κυρίως μέσω του Instagram, του Facebook, του Pinterest, του Snapchat και του Tik Tok. Ωστόσο, είναι σημαντικό να αναγνωρίσουμε ότι το κοινωνικό εμπόριο απευθύνεται σε νεότερους καταναλωτές, ιδίως στη γενιά Ζ, δηλαδή σε άτομα ηλικίας 25 ετών και κάτω.
Με βάση τα ευρήματα της παραπάνω έρευνας, το 43% των ηλικιών 18-24 και το 47% των ηλικιών 25-34 επιλέγουν να εντοπίσουν νέα προϊόντα από τα μέσα κοινωνικής δικτύωσης. Το 33% προχωρά ακόμη και στην αγορά προϊόντων (Jessica Paige, 6 Μαΐου 2021).
Όταν ρωτήθηκαν σχετικά με τη δειγματοληψία προϊόντων, το 87% των ερωτηθέντων στο Ηνωμένο Βασίλειο δήλωσε ότι θα ήθελε να λάβει δωρεάν δείγματα, το 51% δήλωσε ότι θα ήταν πρόθυμο να γράψει μια κριτική για δωρεάν προϊόντα και το 28% δήλωσε ότι θα έκανε μια ανάρτηση σχετικά με το. προϊόν στα μέσα κοινωνικής δικτύωσης. (Jessica Paige, 6 Μαΐου 2021)
Επιτρέποντας στον πελάτη να εξαργυρώσει απευθείας μέσω των πλατφορμών κοινωνικής δικτύωσης, το κοινωνικό εμπόριο καταργεί τα περιττά βήματα και εξορθολογίζει τη διαδικασία αγοράς. Επίσης, πολλοί ιστότοποι δεν διαθέτουν έκδοση για κινητά τηλέφωνα, οπότε είναι δύσκολο για τον καταναλωτή να περιηγηθεί στον ιστότοπο και να μην προβεί σε τελική αγορά, σε αντίθεση με τις πλατφόρμες κοινωνικής δικτύωσης που έχουν κατασκευαστεί για να είναι φιλικές προς τα κινητά (BigCommerce).
Επίσης, με τις κανονικές αγορές, οι έμποροι απευθύνονται σε πολύ μεγαλύτερο κοινό και, ως εκ τούτου, απαιτούν προσεκτική επιχειρηματική παρουσία στα μέσα κοινωνικής δικτύωσης.
Βιβλιογραφικές αναφορές
Social Commerce: How Social Shopping Can Drive Sales (2022). (n.d.). BigCommerce. https://www.bigcommerce.com/articles/omnichannel-retail/social-commerce/
Paige, J. (6 Μαΐου 2021). UK shoppers turn to social media to discover and buy new products. Retail Insight Network. https://www.retail-insight-network.com/features/uk-shoppers-turn-to-social-media-to-discover-and-buy-new-products/
Lingo, M. (31 Ιανουαρίου 2020). UK Consumer Behavior: What Do The British Want? | Wordbank. Wordbank LLC. https://www.wordbank.com/us/blog/market-insights/uk-consumer-behavior/
Gu, S. (n.d.). Impact of the COVID-19 Pandemic on Online Consumer Purchasing Behavior. MDPI. https://www.mdpi.com/0718-1876/16/6/125
Export Enterprises – International Trade Tech Solutions. (n.d.). https://www.export-entreprises.com/
Sustainability & Consumer Behaviour 2022. (n.d.). Deloitte United Kingdom. https://www2.deloitte.com/uk/en/pages/consumer-business/articles/sustainable-consumer.html
Θεωρητικό μέρος – ΣΛΟΒΕΝΙΑ
Πέρυσι, η αγοραστική συμπεριφορά των περισσότερων καταναλωτών επικεντρώθηκε στο διαδίκτυο, σύμφωνα με τη Στατιστική Υπηρεσία της Δημοκρατίας της Σλοβενίας. Κατά το πρώτο τρίμηνο του 2021 έως και το 59% των καταναλωτών ηλικίας 16 έως 74 ετών ψώνιζαν μέσω διαδικτύου και οδηγούσαν έτσι στην αυξανόμενη εξομάλυνση των ηλεκτρονικών αγορών. Αλλά τι κράτησε τους καταναλωτές στο διαδίκτυο και τι μπορούμε να περιμένουμε τα επόμενα χρόνια; Φαίνεται ότι οι καταναλωτές στρέφονται στις ηλεκτρονικές αγορές όχι μόνο από αναγκαιότητα και ευκολία, αλλά και ή ίσως λόγω του ασφαλούς περιβάλλοντος εν όψει της πανδημίας (Polanec, 2022).
Η πρόσφατη μελέτη Shopper’s Mind 2021, η οποία διεξήχθη από συνεργασία των εταίρων Valicon, iPROM και Ceneje.si, δείχνει ότι η αυξητική τάση των ηλεκτρονικών αγορών συνεχίζεται. Στη Σλοβενία, οι ηλεκτρονικές αγορές γίνονται όλο και πιο συχνές και πιο έντονες. Οι περισσότερες αγορές καταγράφονται στις κατηγορίες της μόδας, των ηλεκτρονικών ειδών, του σπιτιού και του κήπου και η μέση αξία της αγοράς είναι σχεδόν 100 ευρώ. Το 73% των Σλοβένων πραγματοποιεί τέσσερις ηλεκτρονικές αγορές ετησίως, ενώ μόλις οι μισοί από αυτούς που ψωνίζουν τακτικά χρησιμοποιούν συχνότερα smartphone και χρεωστικές κάρτες. Η ηλικιακή διάρθρωση των διαδικτυακών πελατών δεν έχει αλλάξει τα τελευταία τρία χρόνια (2019-2021). Οι εκπρόσωποι της γενιάς X (44%) και Z (33%) συγκαταλέγονται μεταξύ των πολυπληθέστερων διαδικτυακών πελατών.
Η σύγκριση των αγορών μεταξύ εγχώριων και ξένων ηλεκτρονικών καταστημάτων δείχνει ότι η συντριπτική πλειονότητα των πελατών πραγματοποιεί αγορές σε εγχώρια καταστήματα (84%, η μέση αξία αγοράς είναι 102 ευρώ), ενώ το 16% των ηλεκτρονικών αγορών πραγματοποιείται σε ξένα ηλεκτρονικά καταστήματα (η μέση αξία αγοράς είναι 56 ευρώ).
Μεταξύ των πιο συχνά χρησιμοποιούμενων μέσων πληρωμής τα τελευταία τρία χρόνια, οι κάρτες όλων των ειδών κυριαρχούν το 2021 (55%), ενώ ακολουθούν τα μετρητά (29%) και η πληρωμή με τιμολόγιο proforma (13%). Η σύγκριση μεταξύ των γενεών δείχνει ότι οι γενιές Z, Y και X είναι πιο πιθανό να προτιμούν τις πληρωμές με κάρτα από ό,τι η γενιά των baby boomers, αλλά οι διαφορές αυτές έχουν μειωθεί ελαφρώς τα τελευταία δύο χρόνια.
Τα τελευταία δύο χρόνια, οι αγοραστές στο διαδίκτυο πραγματοποιούν συχνότερα αγορές μέσω smartphones (με τη βοήθεια των οποίων το 2021 πραγματοποιήθηκε το 55% των αγορών). Οι υπολογιστές (φορητοί και επιτραπέζιοι υπολογιστές) εξακολουθούν να είναι σημαντικοί – το 38% των online αγοραστών πραγματοποιούν τις αγορές τους μέσω φορητών υπολογιστών και το 32% μέσω σταθερών υπολογιστών. Το ένα τρίτο των διαδικτυακών αγορών, αριθμός αρκετά σημαντικός, ολοκληρώνεται από τους καταναλωτές μέσω κινητών τηλεφώνων (38%), ενώ κάτι λιγότερο από το ένα τρίτο μέσω φορητών υπολογιστών (31%) και ένα καλό τέταρτο (26%) μέσω επιτραπέζιων υπολογιστών (Guest author, 2021).
Βιβλιογραφικές αναφορές
Guest author. (2021). Nova raziskava Shopper’s Mind 2021: Spletni kupci v Sloveniji nakupujejo vse pogosteje. Shopper’s Mind. https://smind.si/nova-raziskava-shoppers-mind-2021-spletni-kupci-v-sloveniji-nakupujejo-vse-pogosteje/
Nabernik, N. (2021). SLOVENSKI INFLUENCERJI: KDO SO NAJVPLIVNEJŠI INFLUENCERJI V SLOVENIJI? Omisli.si. https://omisli.si/nasvet-strokovnjaka/influencer-marketing/slovenski-influencerji-kdo-so-najvplivnejsi-influencerji-v-sloveniji/
PJU. (2022). Kako s pomočjo influencer marketinga povečati prodajo? INFLUENCER MARKETING V PRAKSI: STUDY CASE KAMPANJE ZA BREZŽIČNE SLUŠALKE 2019. PJU. https://pju.si/
Polanec, M. (2022). Slovenci so v 2021 na spletu najraje kupovali mobilne telefone in pnevmatike. Shopper’s Mind. https://smind.si/slovenci-v-2021-na-spletu-najraje-kupovali-mobilne-telefone-pnevmatike/
[1] https://www.forbes.com/2006/06/30/jack-trout-on-marketing-cx_jt_0703drucker.html?sh=431fad76555c visit 06.02.2022
[2] “Buyer.” Merriam-Webster.com Dictionary, Merriam-Webster, https://www.merriam-webster.com/dictionary/buyer. Accessed 7 Feb. 2022.
[3] “Customer.” Merriam-Webster.com Thesaurus, Merriam-Webster, https://www.merriam-webster.com/thesaurus/customer. Accessed 7 Feb. 2022.
[4] “Consumer.” Merriam-Webster.com Thesaurus, Merriam-Webster, https://www.merriam-webster.com/thesaurus/consumer. Accessed 7 Feb. 2022.
[5] Edinburgh Business School – Consumer Behaviour Jane Priest, Stephen Carter, David A. Statt
[6] https://ec.europa.eu/eurostat/statistics-explained/index.php?title=E-commerce_statistics_for_individuals#General_overview
[7] Steven Hob Four Types of Buying Behaviour https://www.youtube.com/watch?v=Bnrdv-7ndFo visited 13.02.2022
[8] https://ecommerce-europe.eu/wp-content/uploads/2021/09/2021-European-E-commerce-Report-LIGHT-VERSION.pdf
[9] 5 Stages of the Consumer Decision-Making Process and How it’s Changed https://www.youtube.com/watch?v=a9lpVg54u-k
[10] https://www.gpec.ro/blog/en/gpec-romanian-e-commerce-2020-report-5-6-billion-euro-worth-of-online-shopping-a-30-yoy-growth
[11] https://ecommercenews.eu/popular-payment-methods-in-europe-in-2022/
[12] Romanian Consumer Behaviour and Payment Choice
in Online Shopping. A Marketing Perspective
Mihaela CONSTANTINESCU*, Andreea ORINDARU, Daniela IONIȚĂ, Ștefan-Claudiu CĂESCU, DOI: 10.2478/9788366675162-006